
➥ Go to the beginning of the free online Excel Course
- Calculating the percentage change in Excel will allow you to compare quantities and the difference between them
- We have several ways to do it, but a pivot table is one of the easiest options.
- What is the process to follow to calculate the percentage change in Excel with pivot tables?
If you apply percentages in any way to your life, you probably realize how important they are. Entire businesses depend on the correct calculation of the percentages and, from there on down, it is essential to have tools that allow us to do them without errors. Knowing how to calculate the percentage change in Excel will allow you to compare various amounts and what is the difference between them. Let’s see how to do it.
As in many other cases, Excel can be your best ally in these situations, so we will analyze some ways to use the calculation of percentage differences in this Office program, and how to do it professionally taking advantage of pivot tables, one of the best tools of the application.
Why is calculating percentage change in Excel relevant?
As we said, the percentage changes allow us to know how much one value has changed from the next. That is to say, it is a system to know the progress of a specific record, without making it so difficult for us. You could calculate, for example, how your sales are evolving over the days, months or years.
This function is especially useful when we want to track data over time, so you will probably find different ways to use it, different ways to include it in your study, in your work or in your company.
How to calculate percentage change in Excel?
With the Percent Change function
While there is more than one way to calculate percentage change in Excel, the simplest method to do this is to call the Percent Change function, which takes two arguments and compares them directly.
Only you must enter the two values, in separate cells, and select the cell where the result will go. Write or paste there: «= PERCENTCHANGE(old value, new value)” – for example, “= PERCENTCHANGE(A1, A2)«.
Immediately the function will do the calculation, and it will tell you what is the difference between both numbers..
Eventually, you can use a shorthand formula to find the percentage change, like this: =PERCENTCHANGE(10,15). As you type this, the result will be 50%, which is the percentage change already known. This would return a result of 50%, indicating that the new value is 50% higher than the old value. That would indicate, without going any further, that sales grow by 50% between 10 a.m. of the first month and 3 p.m. of the second.
With a pivot table
As we said before, the other option is to resort to a magical instrument, such as pivot tables. We believe that you should choose this alternative if the numbers to be compared are more than two or three. Basically, this means that, in rare cases, it’s best not to stop and go to pivot tables.
- Select the cells that contain the data you want to include in the pivot table
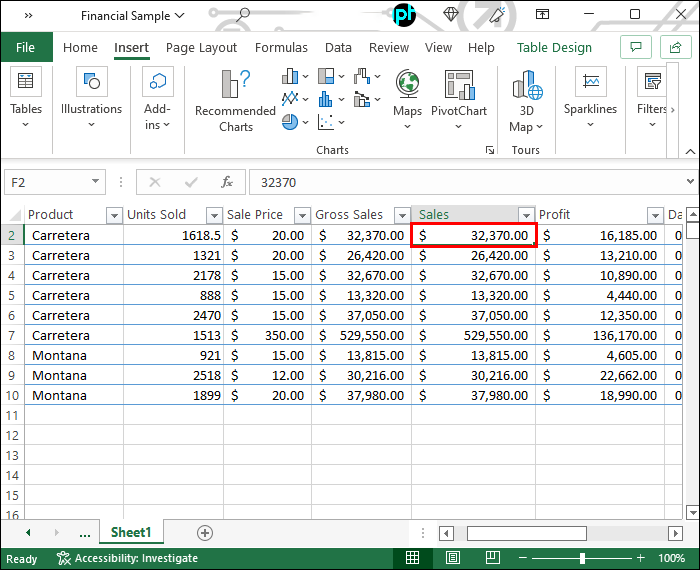
- Click the Insert tab and click PivotTable from the dropdown menu

- In the dialog box that appears on the screen, make sure the correct data range is selected, as well as New worksheet is checked, and click OK to confirm.

- Drag the field for which you want to calculate the percentage change to the Values area of the PivotTable

- Choose Value Field Settings from the context menu and Show Values How from the dropdown menu
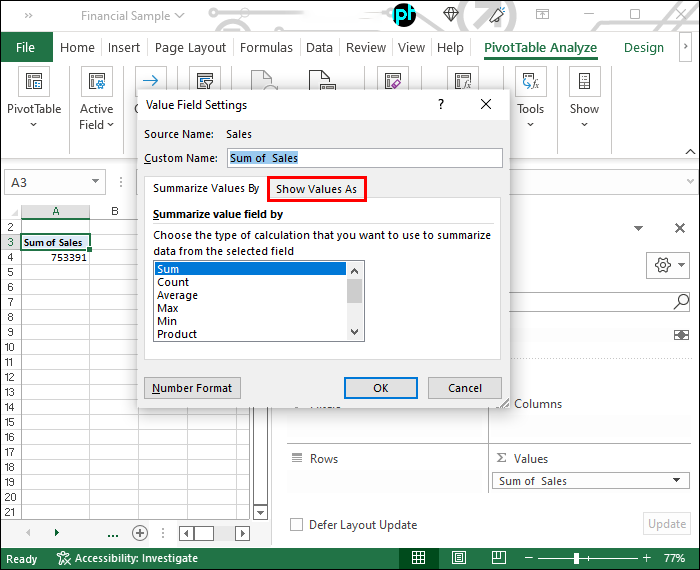
- Select Percent Difference From” in the second dropdown menu and click OK to apply these changes. The pivot table will now display percentage changes for the entire selected field

This technique that we just taught you will allow you to calculate all kinds of percentages, including percentage changes in values that develop over time, so worth updating.
All you need is a little practice to get used to pivot tables and the great potential they have.so we recommend that whenever possible, you try to solve your problems with them.

