
A Microsoft PowerPoint presentation is only as powerful as the content placed on each of its slides. One option is to create a flow chart. One type of diagram, a flowchart represents a workflow or process and typically includes boxes and arrows. You can create a flow chart of these elements in a PowerPoint presentation to help your audience better understand a model solution to a particular problem. Here’s how to do it.
How to Create a Flowchart in PowerPoint
You can insert a flowchart into a PowerPoint presentation by using a SmartArt graphic. For it:
- Open Powerpoint and the presentation to which you want to add a flowchart.
- Go to the corresponding slide.
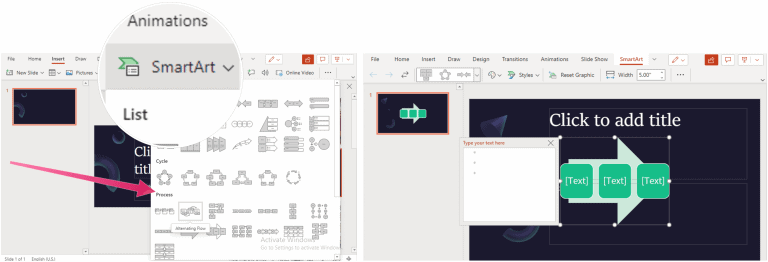
- Click on SmartArt on the Insert tab.
- On the left, select the Process category in the dialog Choose a SmartArt graphic.
- Single-click a flowchart in the center pane to see its name and description in the right pane of the dialog.
- Select the Flowchart you want to use.
- Click on To accept.
Next:
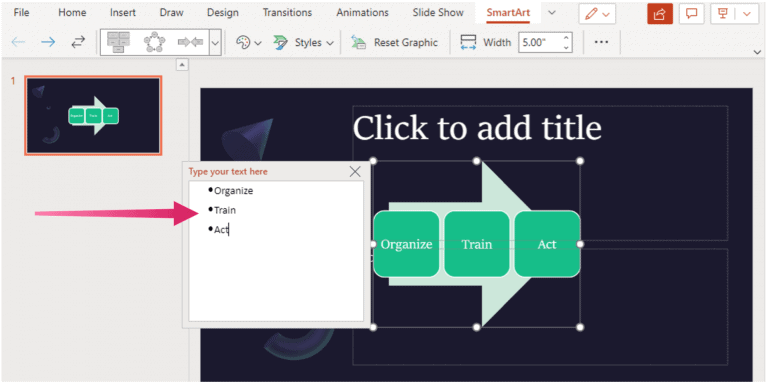
Click on the position marker [Texto] with the correct steps in your flow chart.
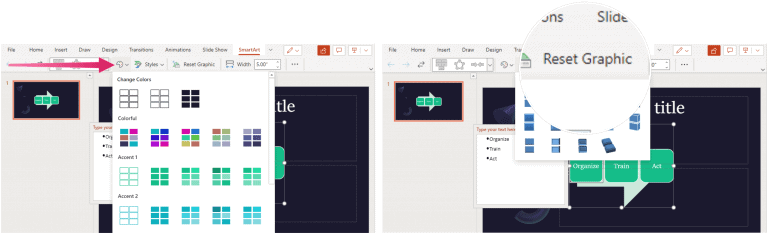
You can also change the color and style of the SmartArt graphic. Click the SmartArt Design tab with your slide selected, then choose Change Colors or Style and make the changes. Click on Reset chart to return the organization chart to its original appearance.
PowerPoint is within the Microsoft 365 suite. The Microsoft 365 suite is currently available in three varieties for home use, including a Family, Personal, and Home and Student plan. Price-wise, the first is $ 100 a year (or $ 10 a month) and includes Word, Excel, PowerPoint, OneNote, and Outlook for Mac. The subscription covers up to six users. The personal version is for a single individual and costs $ 70 per year or $ 6.99 per month. Lastly, the student plan is a one-time purchase of $ 150 and includes Word, Excel, and PowerPoint. Business users can choose from Basic, Standard, and Premium plans, starting at $ 5 per user / month.


